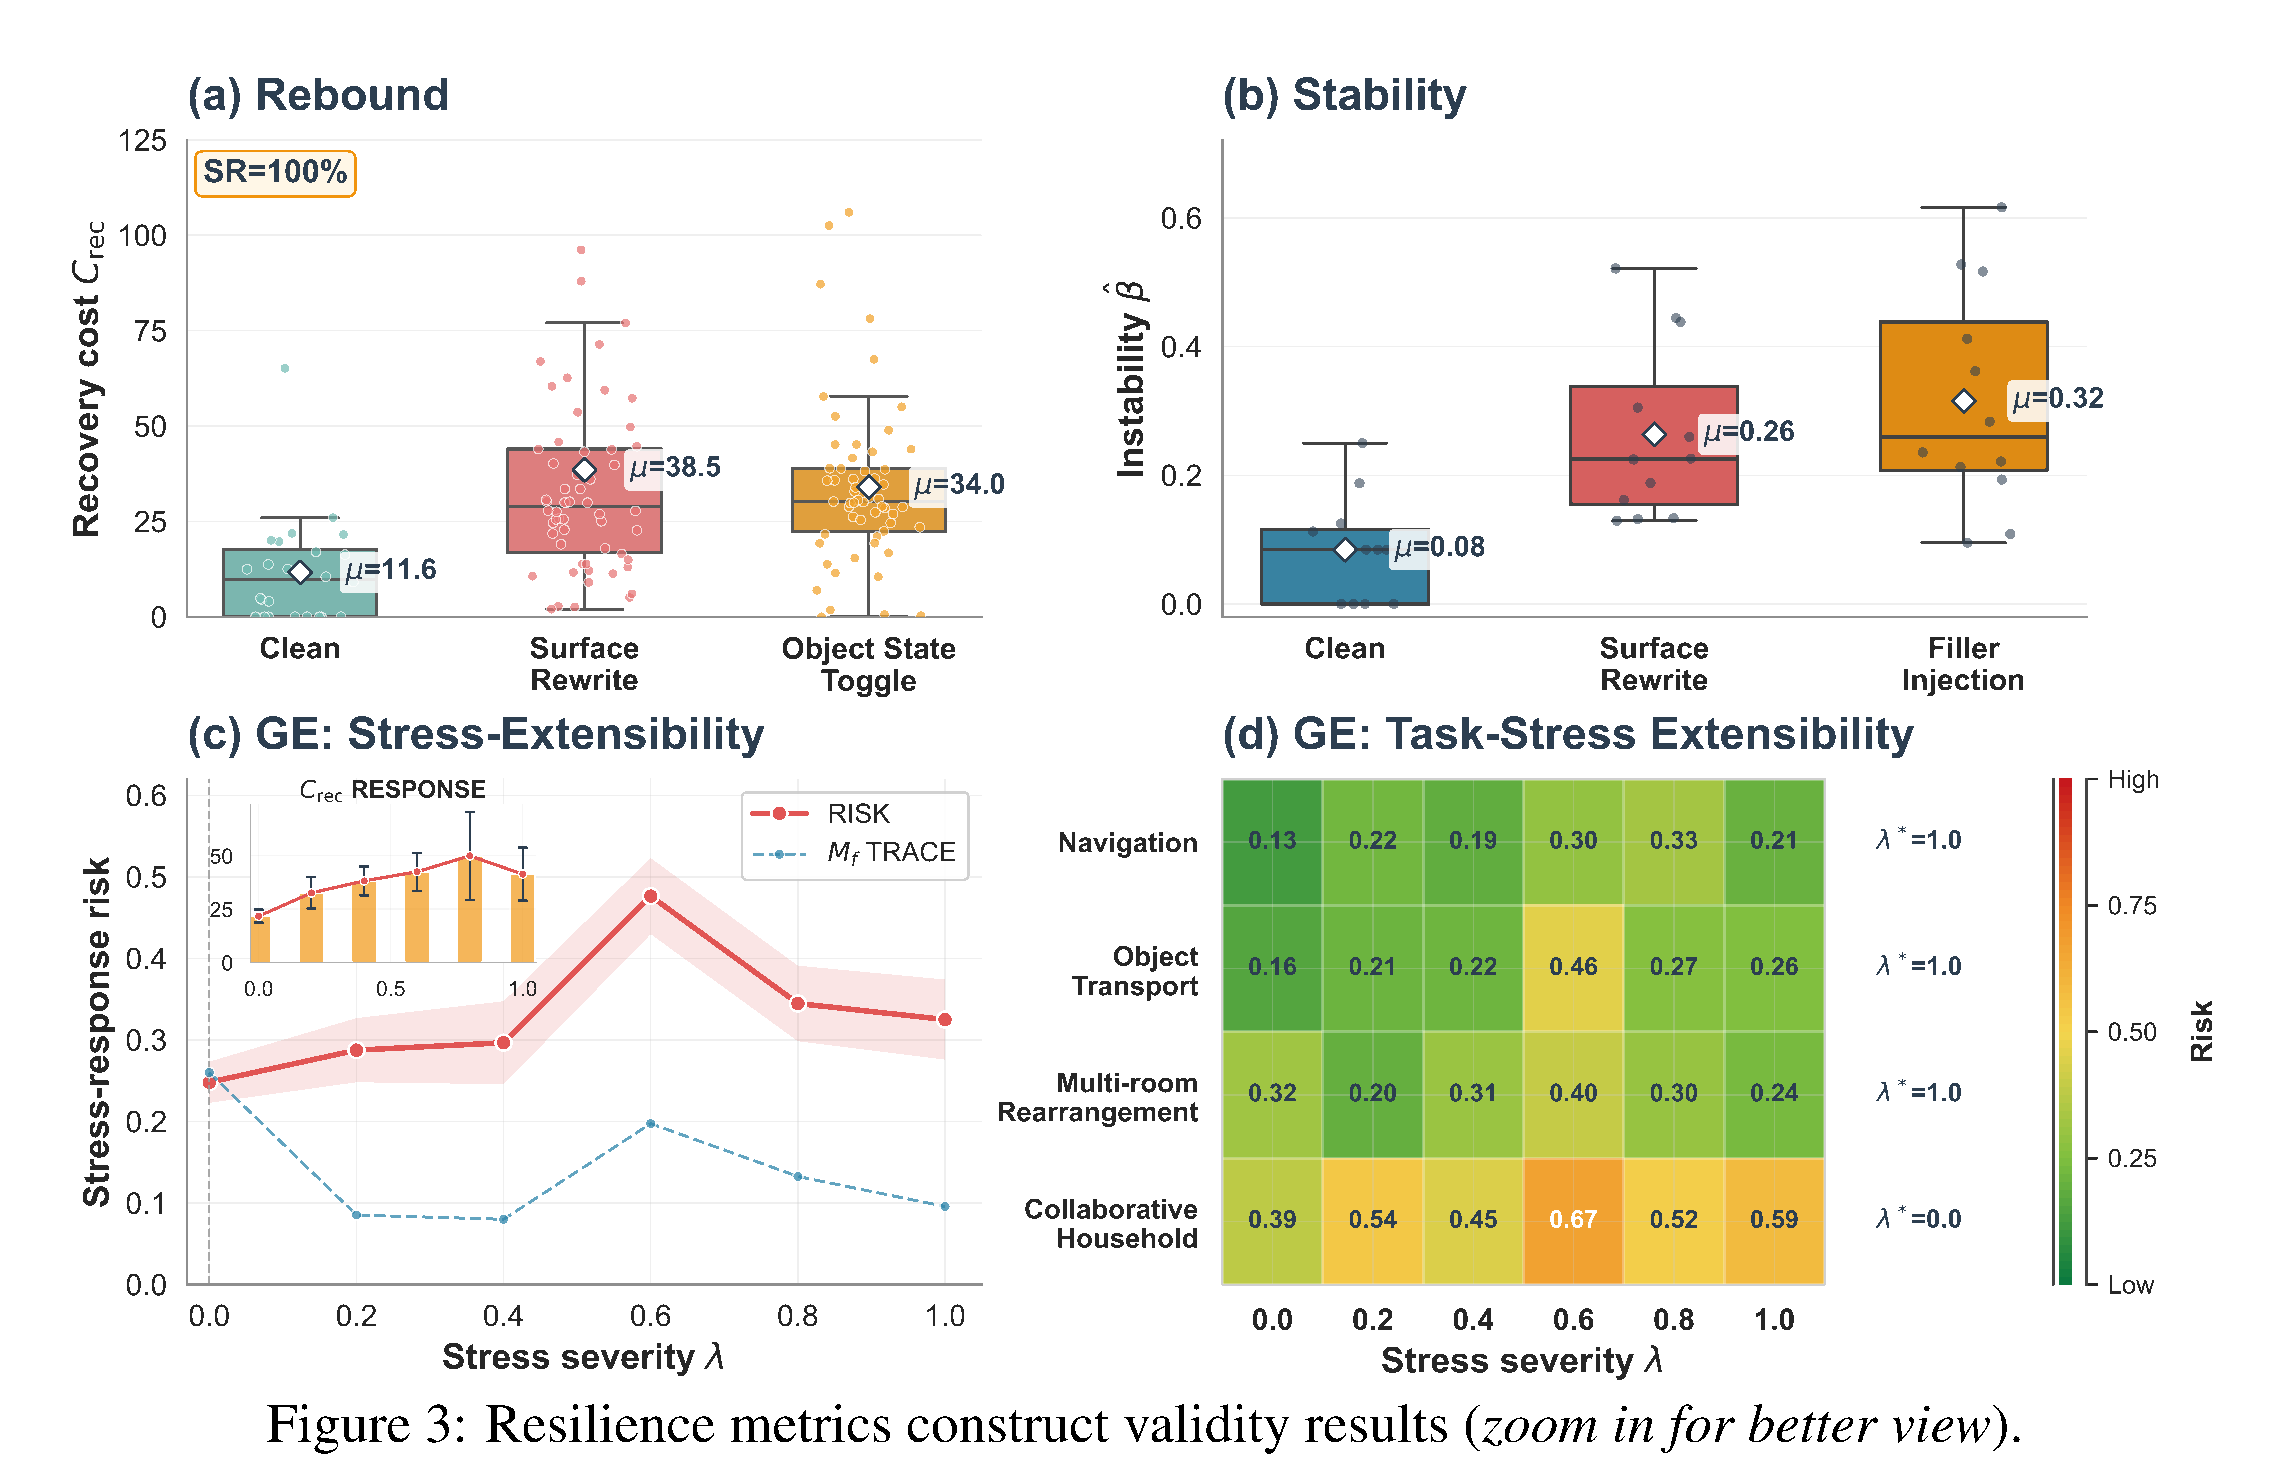
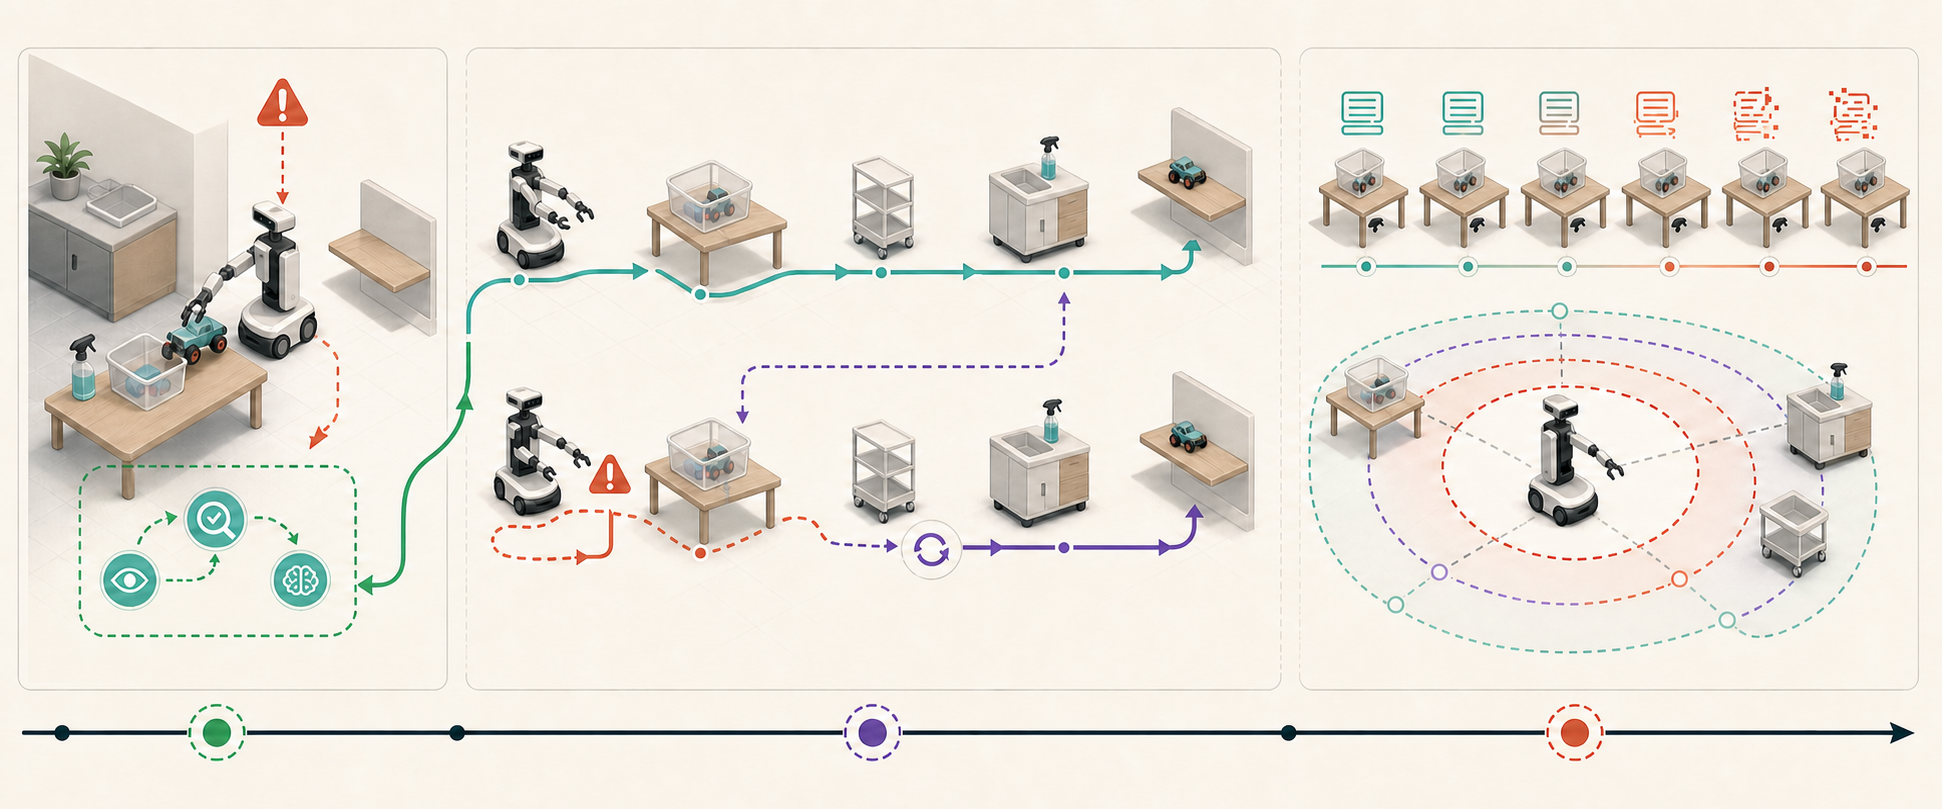
We aggregate normalized recovery burden within the closed window.
Recovery cost
- Definition
- Normalized excess work required to restore acceptable execution.
- Statistical unit
- One rollout, within each closed window \([t_d,t_r]\).
EAS ResilienceEmbodied agent evaluation
Measure how agents recover, remain stable, and sustain service as execution stress increases.We reveal the embodied tasks execution resilience in EAS process.
METRICS · 01
Rebound measures recovery burden. Stability compares clean and stressed trajectories. GE finds sustained capacity across a complete stress grid.
We aggregate normalized recovery burden within the closed window.
We normalize the clean–stress mean-loss change by λ_realized.
λ* is the largest continuously supported stress level from λ=0.
Formal GE requires multiple valid \(\lambda\) cells.
Open GEBENCHMARK · 02
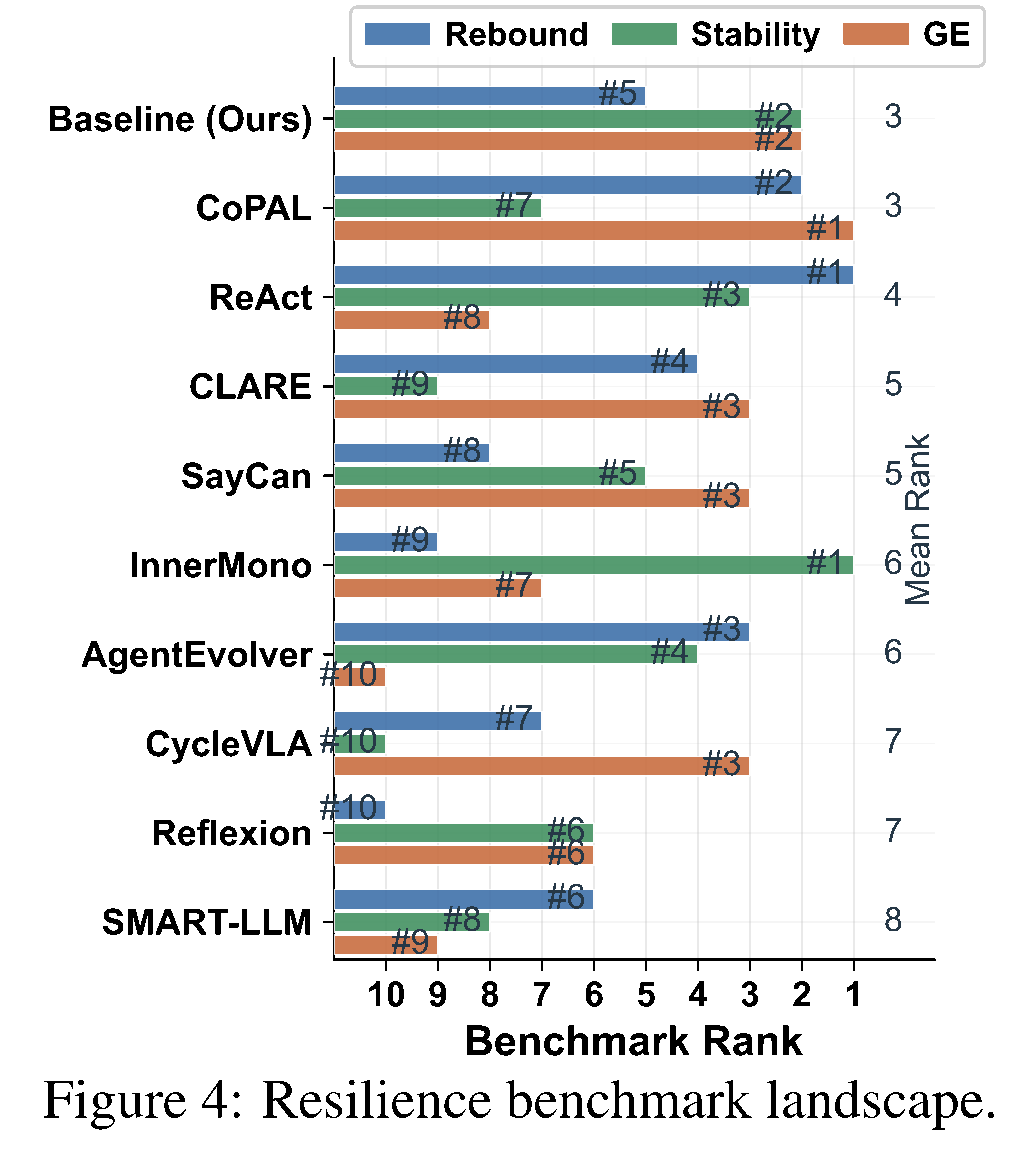
Ten EAS methods across 400 household tasks reveal distinct process-level strengths; no method dominates every resilience aspect.
ReAct · SR 38.5%
InnerMono · completion 67.5%
CoPAL · completion 72.6%
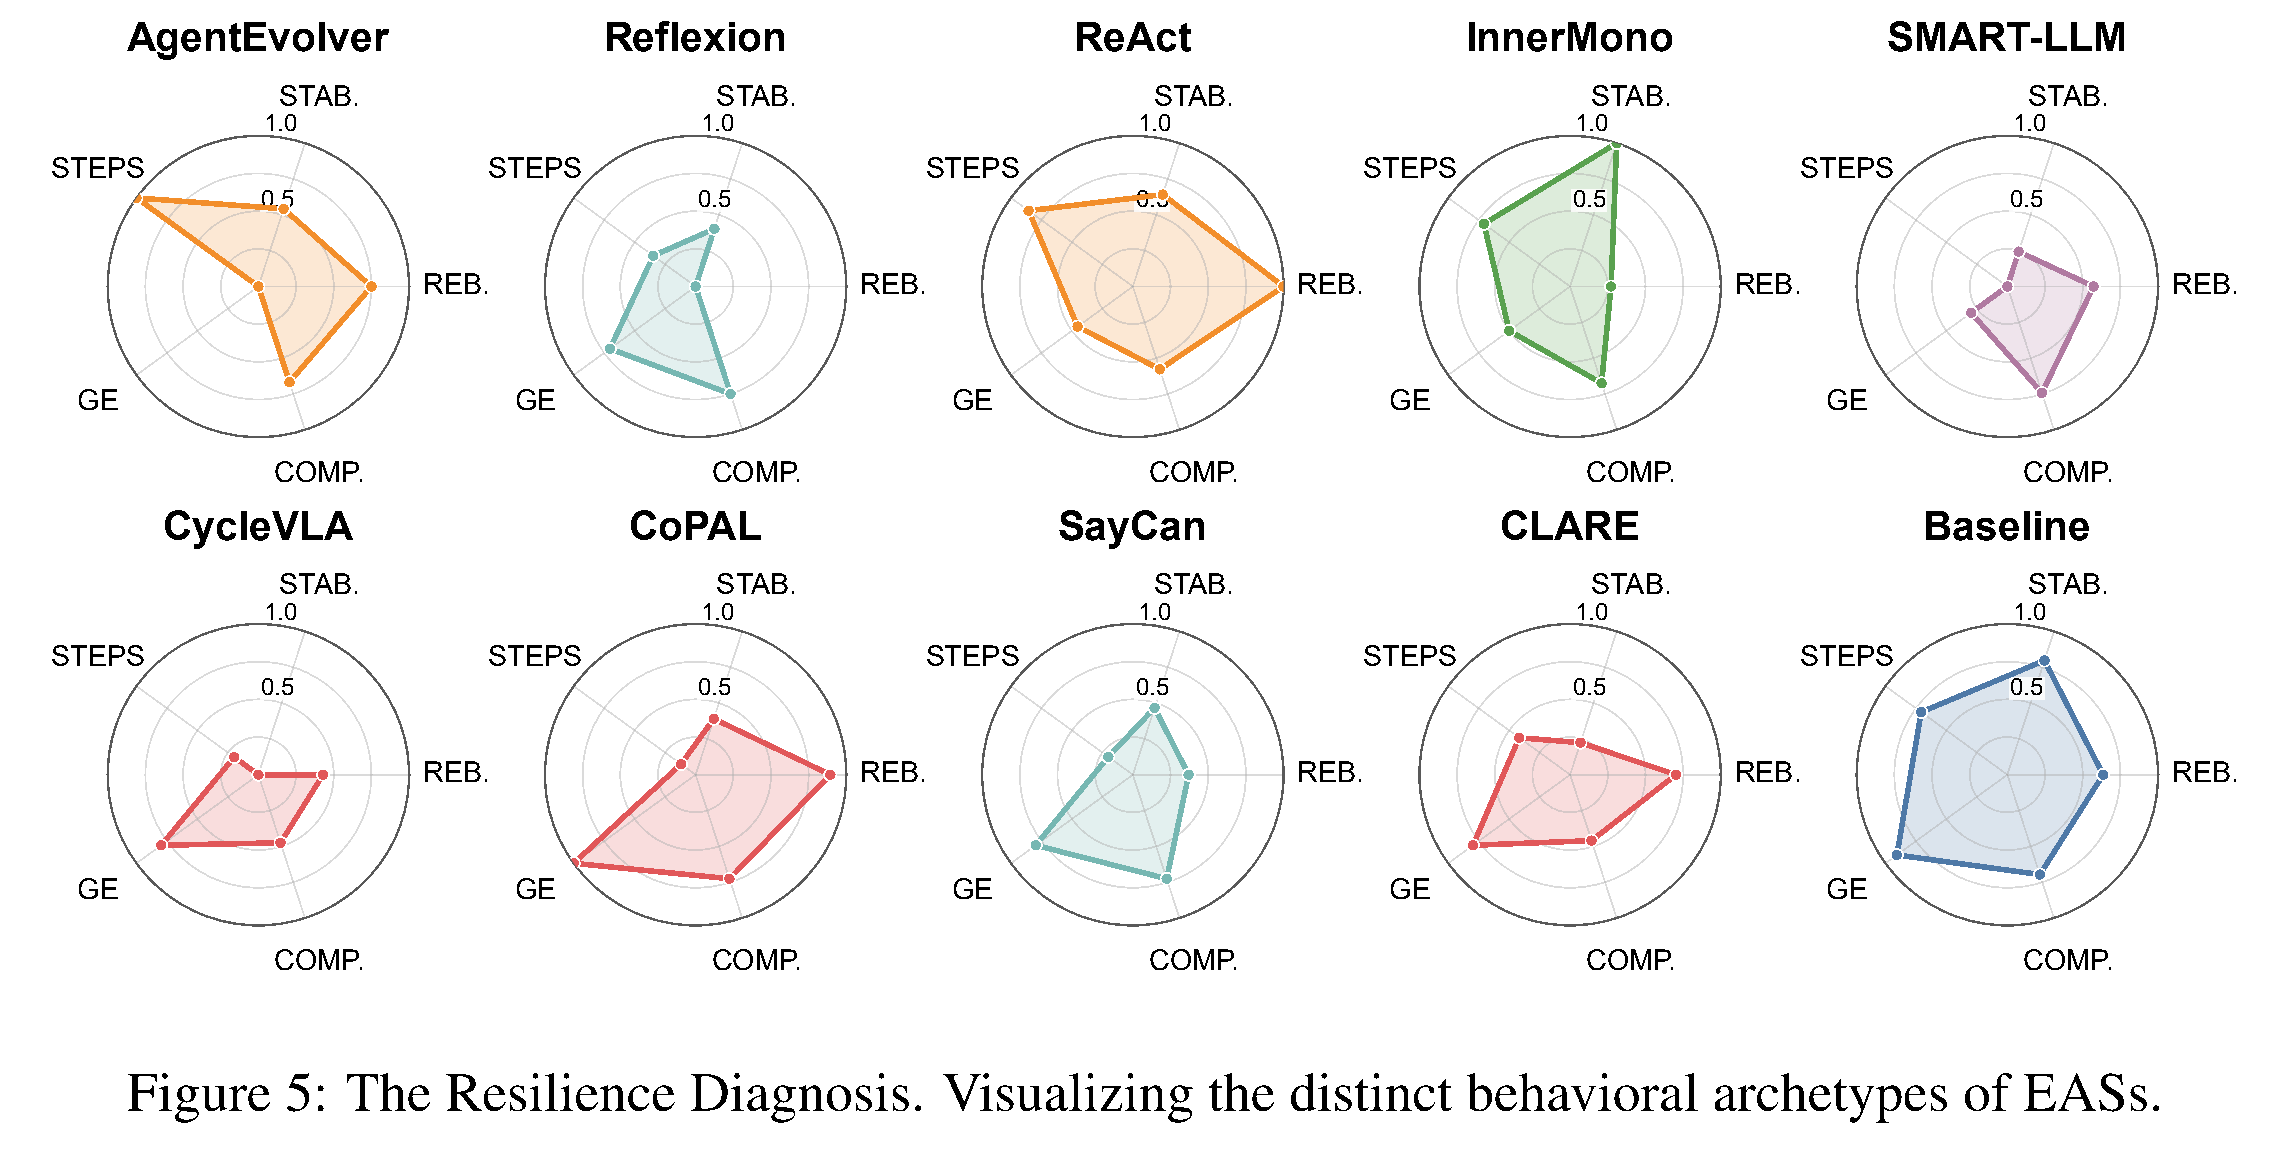
Each method exhibits a distinct resilience signature.
TABLE 2 · INTERACTIVE
FIGURES 2–5

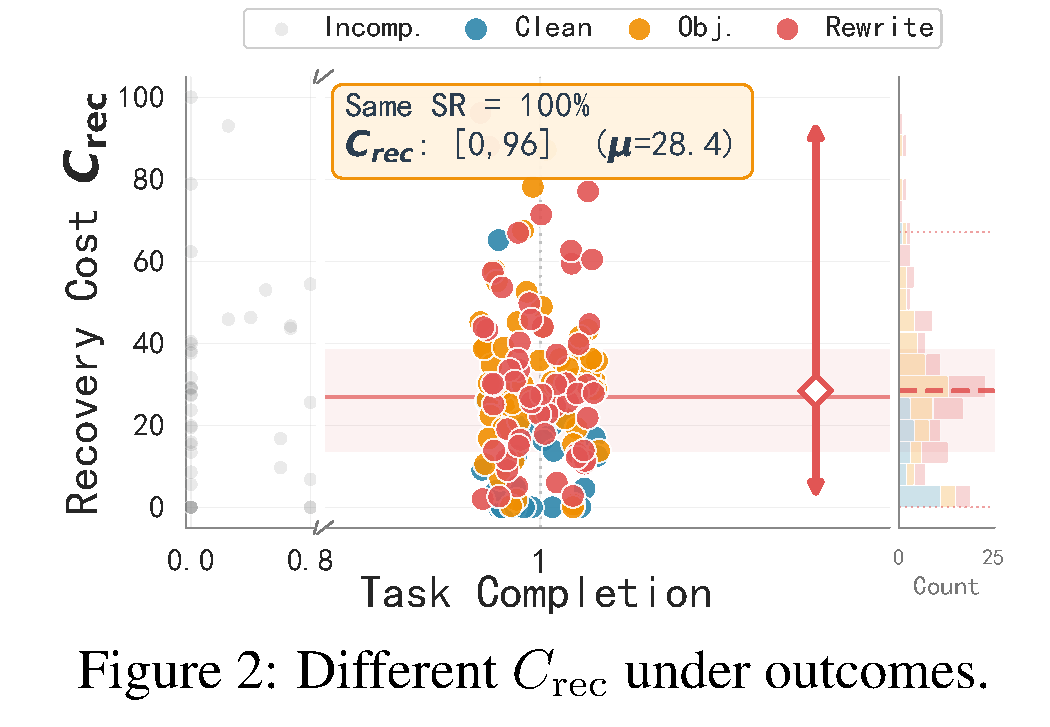
Mean recovery cost is 28.4. Endpoint success leaves a wide process-level burden unresolved.


We use ordinal ranks to diagnose aspect-specific strengths and report mean rank only as a descriptive summary.
Distinct behavioral archetypes of EASs.
\(\mathrm{STAB}_m=\frac{\beta_{\max}-\beta_m}{\beta_{\max}-\beta_{\min}}\), \(\mathrm{REB}_m=\frac{C_{\max}-C_m}{C_{\max}-C_{\min}}\), \(\mathrm{COMP}_m=\frac{\mathrm{Completion}_m}{100}\), \(\mathrm{GE}_m=\lambda_m^*\), \(\mathrm{STEPS}_m=\frac{S_{\max}-S_m}{S_{\max}-S_{\min}}\).
INSPECT METHOD
| Method | \(C_{\mathrm{rec}}\) ↓ | \(\beta\) ↓ | Stress capacity \(\lambda^*\) ↑ | SR | Completion | Sim. steps |
|---|---|---|---|---|---|---|
| ReAct | 6.5 ± 0.46 | 0.239 ± 0.011 | 0.50 ± 0.042 | 38.5% ± 3.1% | 57.8% ± 4.6% | 3,374 ± 285 |
| Reflexion | 57.3 ± 5.07 | 0.299 ± 0.021 | 0.66 ± 0.035 | 56.3% ± 4.2% | 75.0% ± 3.8% | 4,390 ± 312 |
| CycleVLA | 35.5 ± 2.91 | 0.400 ± 0.026 | 0.72 ± 0.047 | 22.2% ± 2.8% | 47.5% ± 4.1% | 4,688 ± 420 |
| CLARE | 21.6 ± 1.68 | 0.344 ± 0.016 | 0.72 ± 0.052 | 28.4% ± 3.5% | 46.0% ± 4.5% | 4,249 ± 360 |
| SayCan | 38.5 ± 2.49 | 0.283 ± 0.013 | 0.78 ± 0.046 | 57.0% ± 4.1% | 72.6% ± 3.7% | 4,682 ± 380 |
| AgentEvolver | 19.2 ± 1.24 | 0.264 ± 0.012 | 0.21 ± 0.015 | 48.8% ± 3.9% | 66.8% ± 4.2% | 3,084 ± 250 |
| InnerMono | 43.5 ± 2.69 | 0.149 ± 0.007 | 0.53 ± 0.026 | 49.5% ± 4.0% | 67.5% ± 4.3% | 3,670 ± 290 |
| CoPAL | 11.9 ± 1.02 | 0.302 ± 0.017 | 0.85 ± 0.078 | 55.8% ± 4.5% | 72.6% ± 3.9% | 4,846 ± 410 |
| SMART-LLM | 28.2 ± 2.20 | 0.339 ± 0.018 | 0.40 ± 0.036 | 55.7% ± 3.8% | 74.3% ± 4.1% | 5,085 ± 395 |
| Baseline | 25.0 ± 2.03 | 0.200 ± 0.009 | 0.79 ± 0.042 | 53.0% ± 3.6% | 69.7% ± 3.5% | 3,671 ± 275 |
OPTIMIZATION · 03
Each intervention addresses one diagnosed execution failure while reporting both the intended gain and its cross-aspect trade-offs.
We use World-Graph evidence and execution feedback to produce bounded recovery guidance.
We use a read-only phase record to constrain replanning drift while preserving adaptation.
We use a bounded cognitive reset to convert persistent waiting into measurable boundary execution.
| Target | Variant | Rebound Crec ↓ | Recovery windows ↓ | βstep ↓ | β ↓ | GE completion ↑ | Formal GE |
|---|---|---|---|---|---|---|---|
| Rebound | Baseline | 59.11 | 3.13 | 0.2881 | 0.6834 | 0.887 | — |
| Optimized | 33.73 ↓42.94% | 2.38 ↓23.96% | 0.2079 ↓27.84% | 0.6870 ↑0.53% | 0.819 ↓7.67% | — | |
| Stability | Baseline | 51.01 | 2.63 | 0.3185 | 0.6788 | 0.903 | — |
| Optimized | 43.01 ↓15.68% | 3.00 ↑14.07% | 0.2552 ↓19.87% | 0.6772 ↓0.24% | 0.750 ↓16.94% | — | |
| GE | Baseline | 36.70 | 1.33 | 1.4594 | 0.6917 | 0.833 | Incomplete |
| Optimized | 99.59 ↑171.36% | 2.25 ↑69.17% | 0.7215 ↓50.56% | 0.6371 ↓7.89% | 0.917 ↑10.08% | Complete† | |
| † Formal GE is reported only for GE stress tests because it requires a stress-response curve over the λ grid. | |||||||
SIMULATION EXECUTION
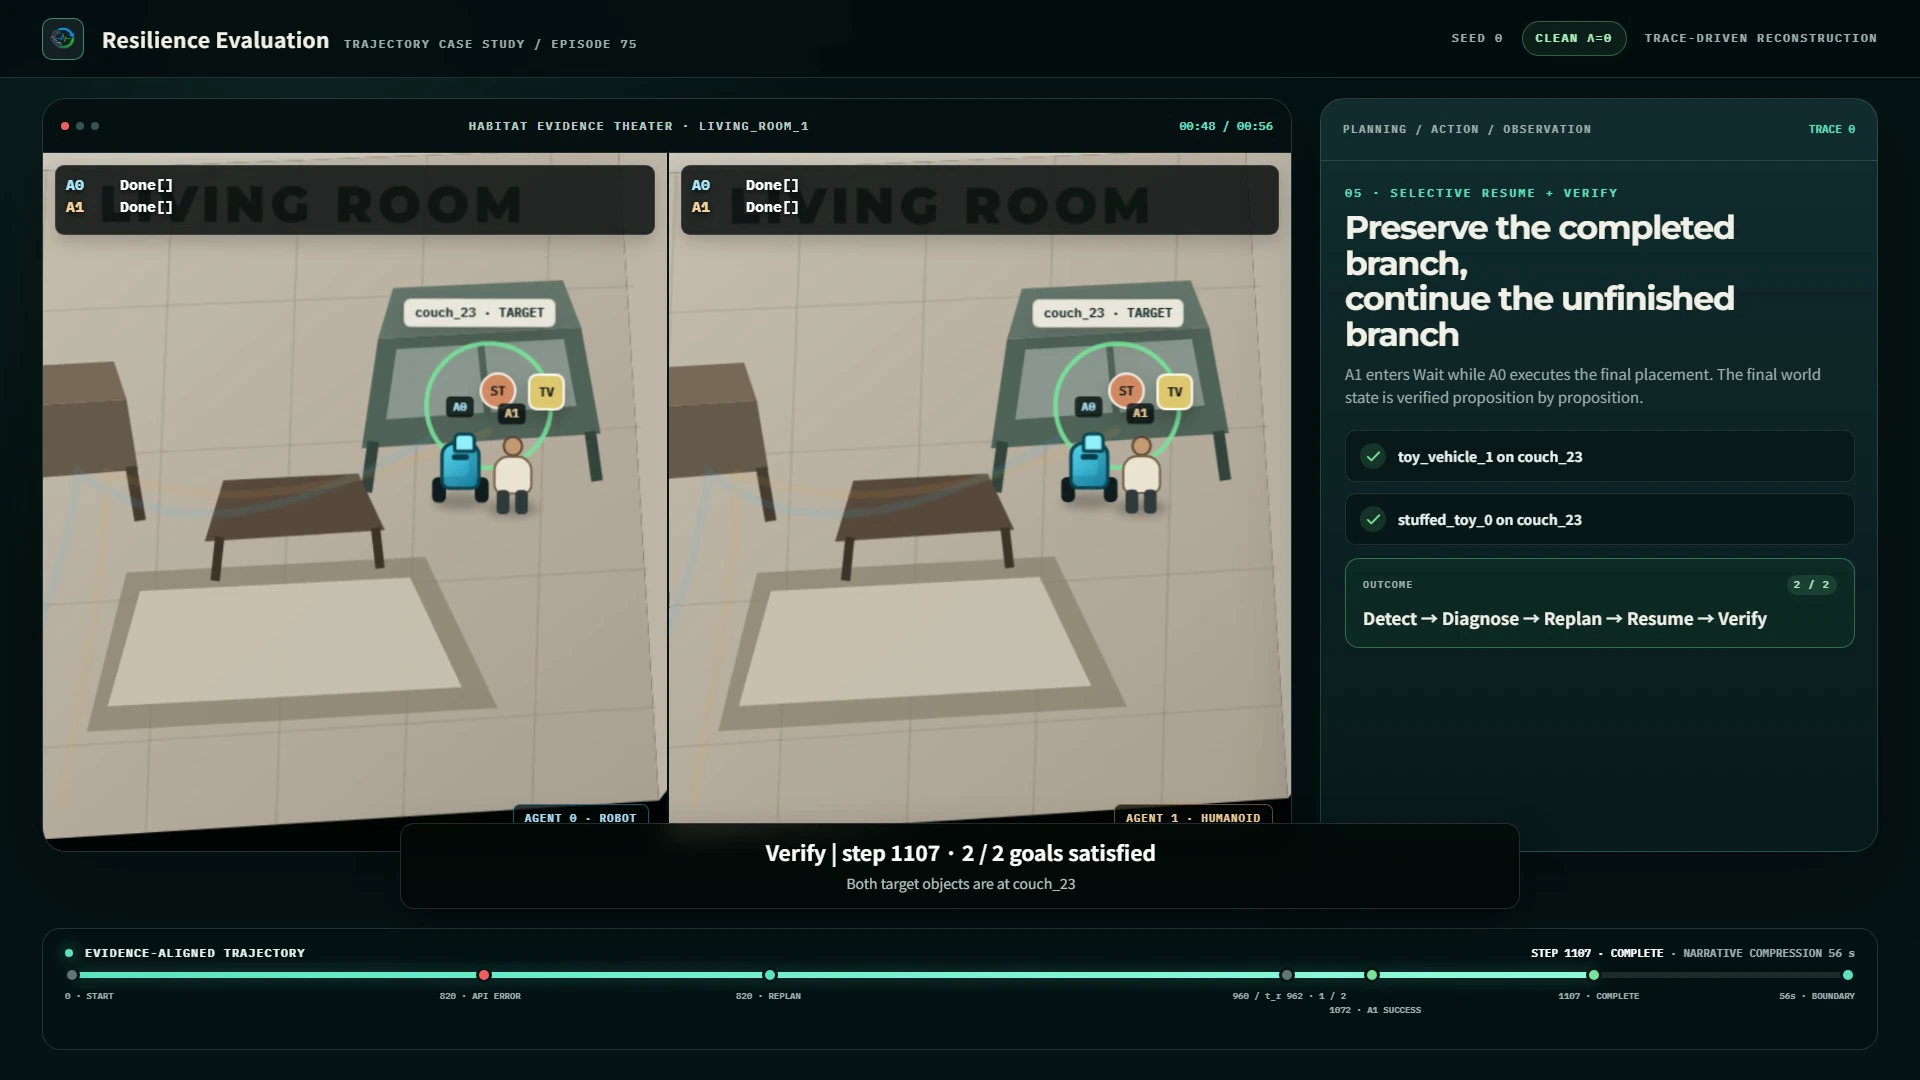
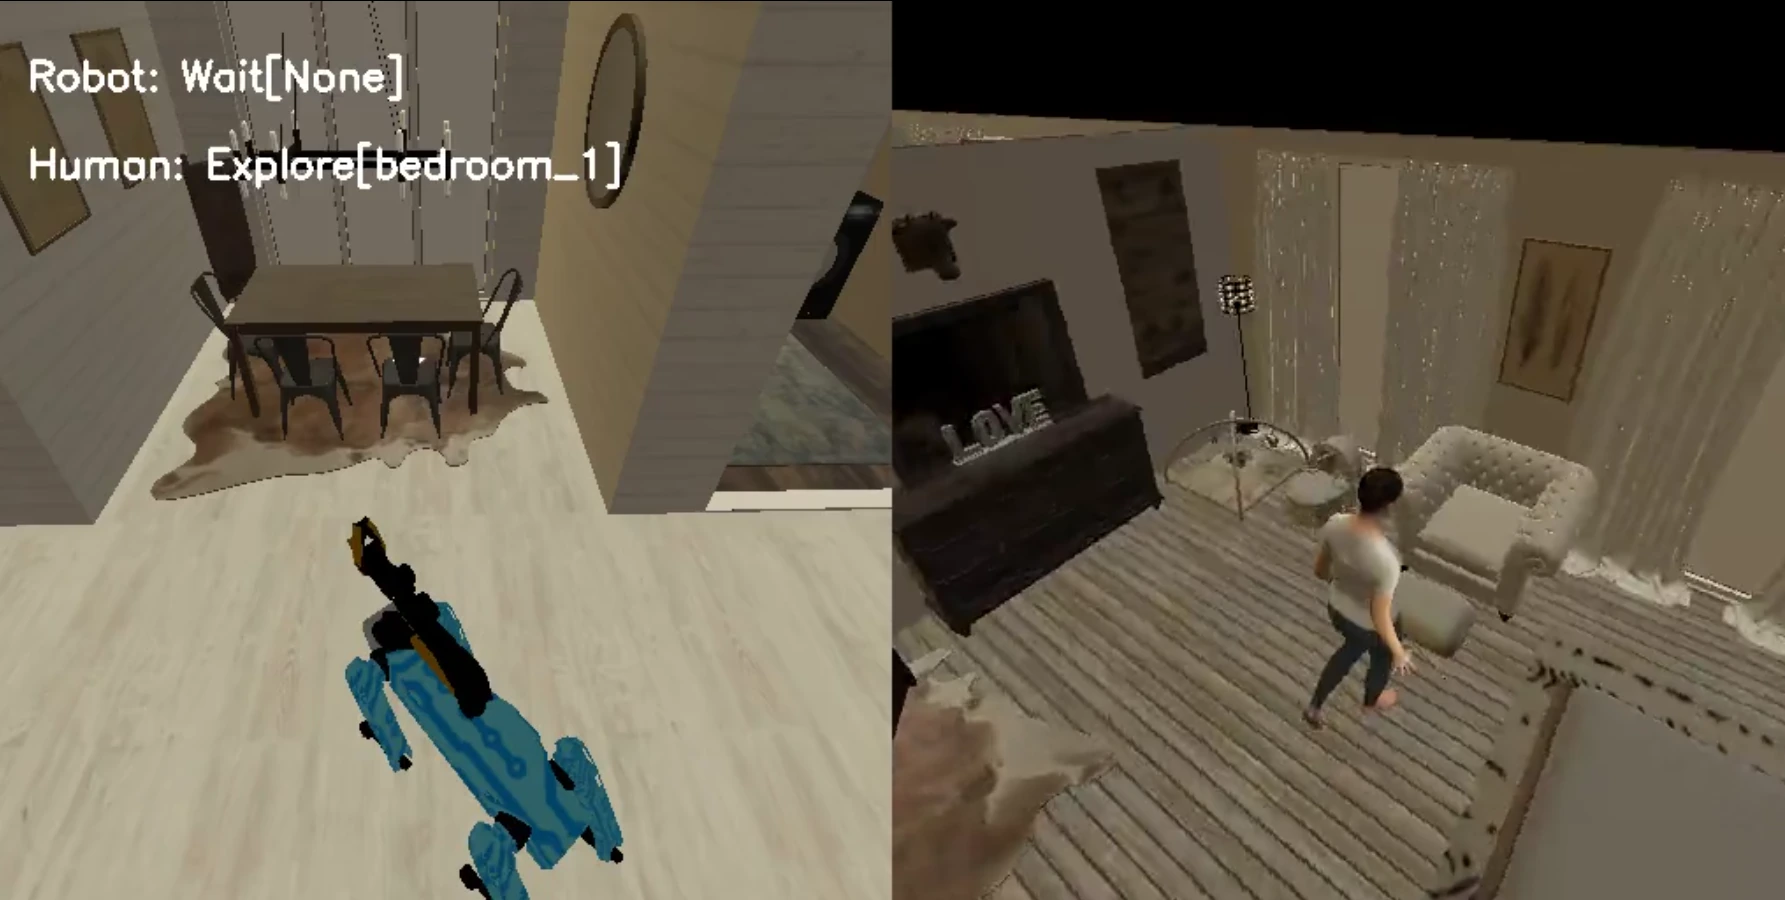
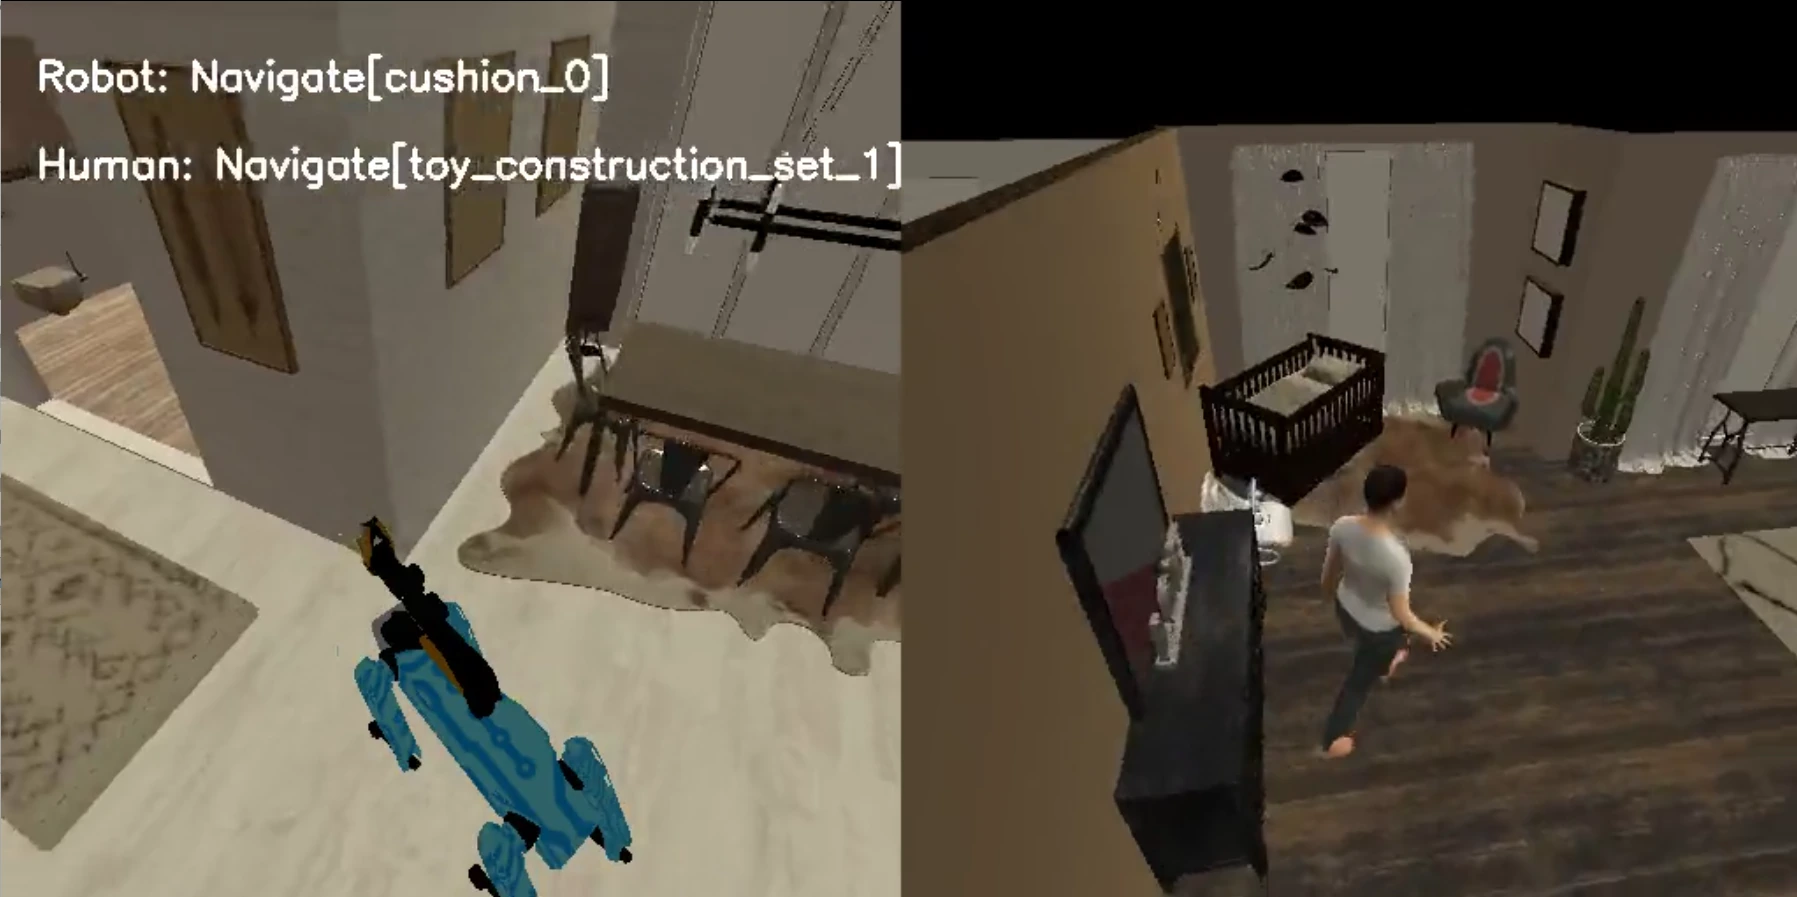
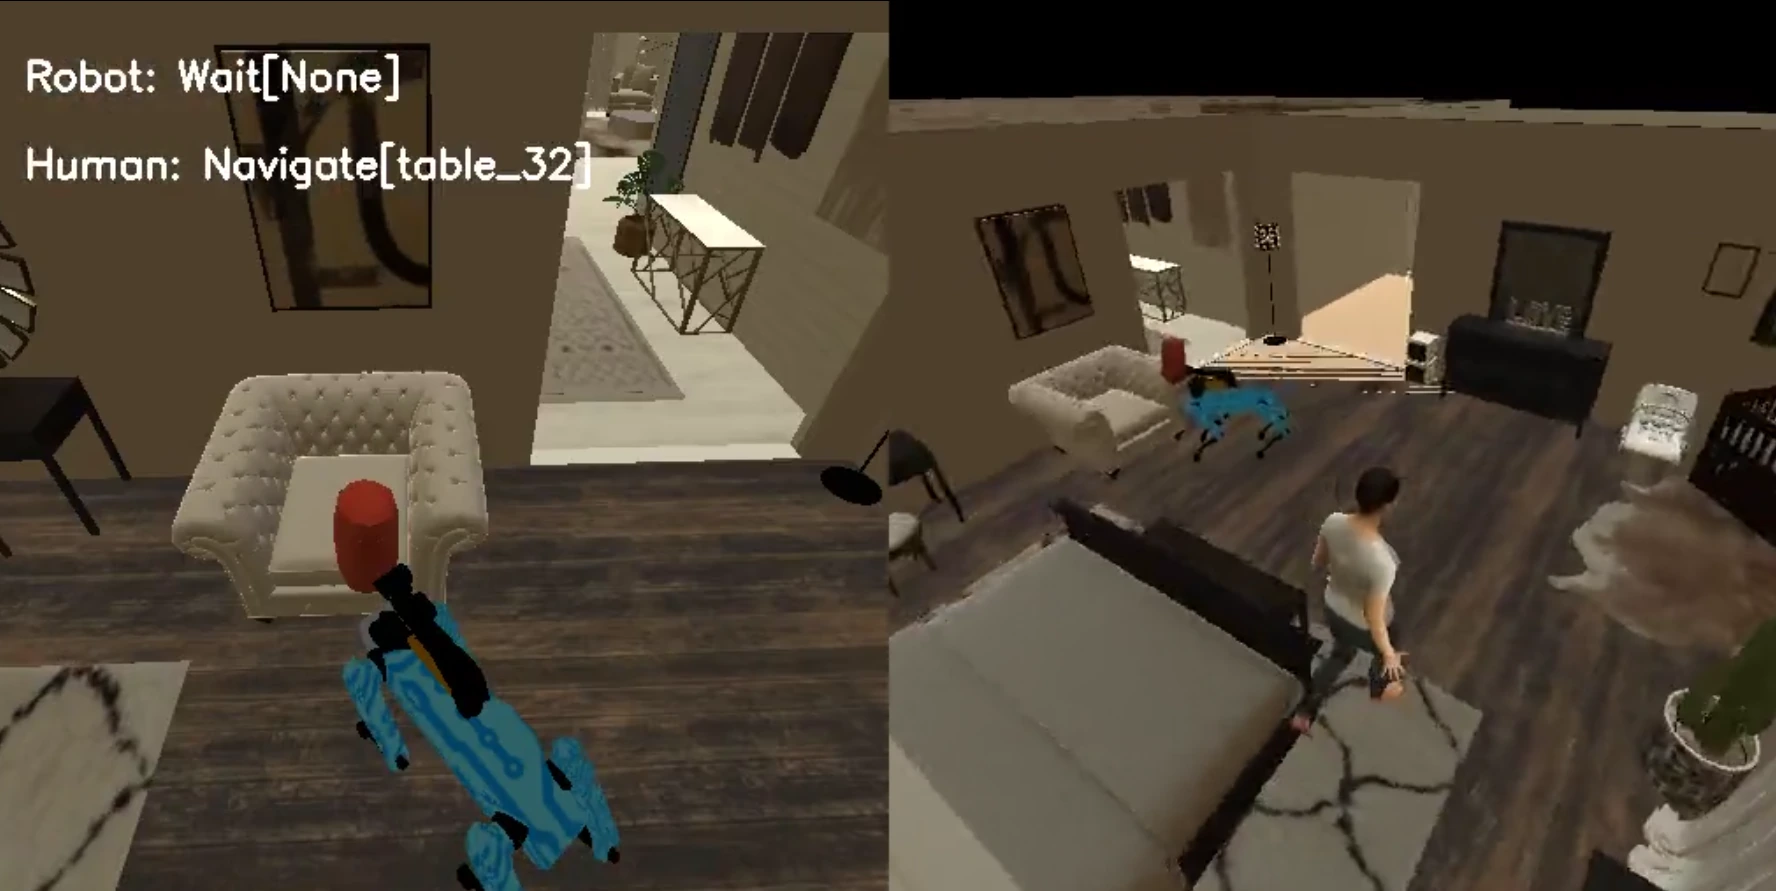
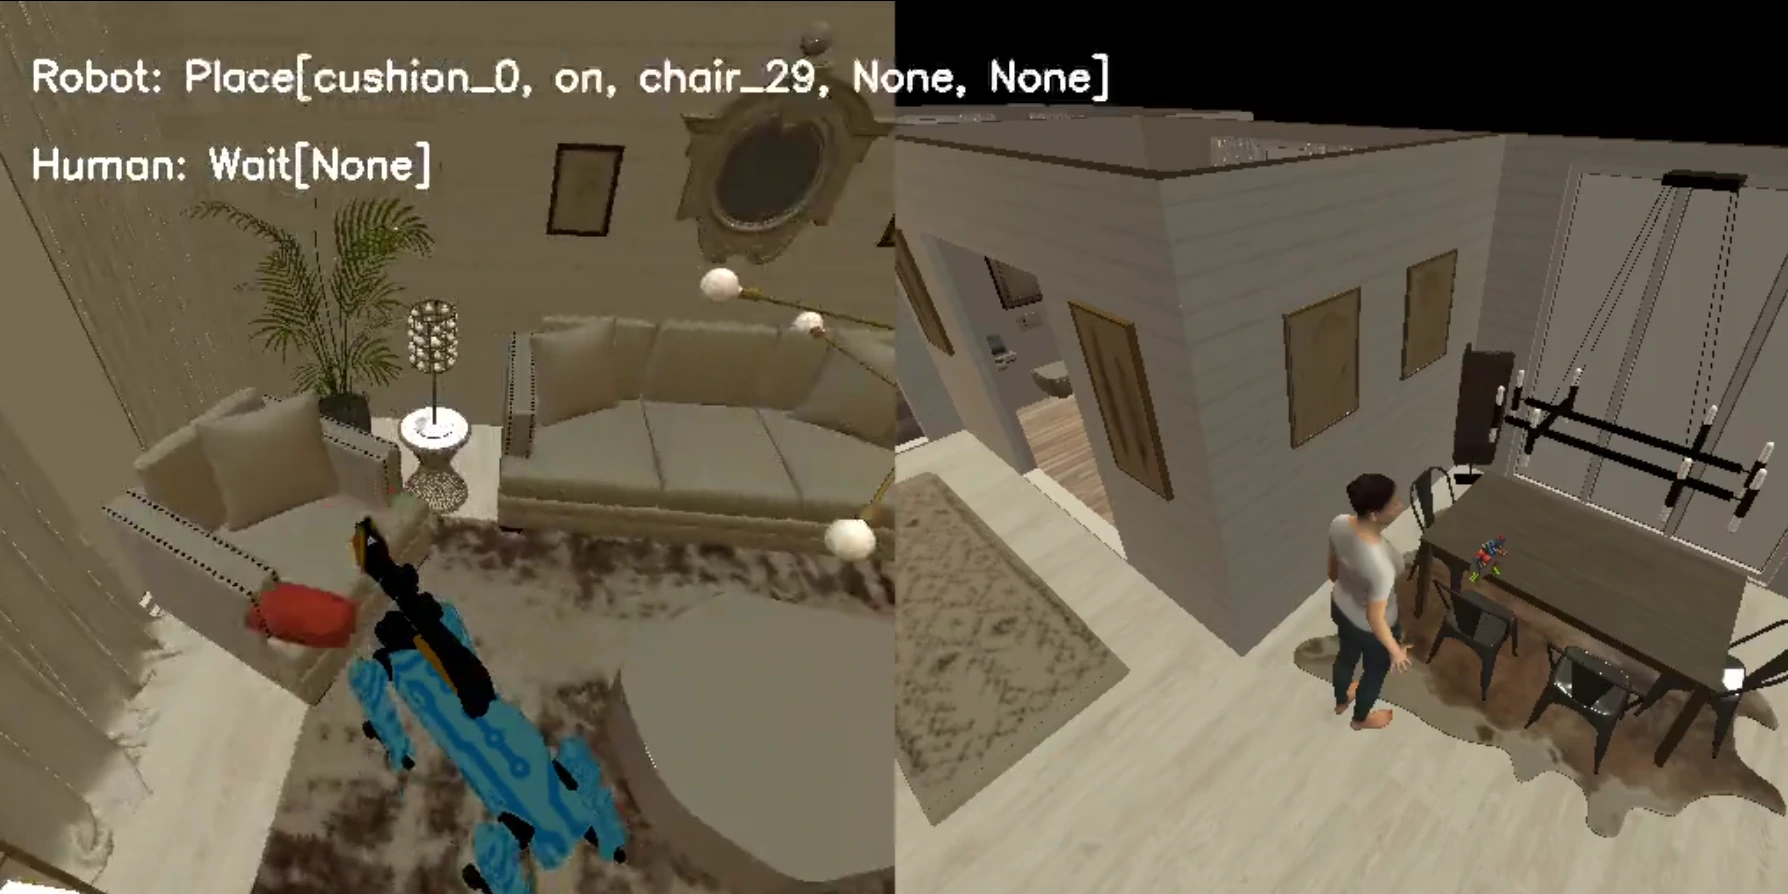
Episode 75 connects instructions, plans, simulator feedback, metrics, and verification across six narrated acts. A labeled task 52 clip provides representative Habitat 3.0 visual context; the remaining scene is trace-driven reconstruction.
Move stuffed_toy_0 and toy_vehicle_1 from chair_32 to couch_23.
VIDEO READY · Select an act to seek; playback remains paused
clean seed 0 · λ=0
API mismatch
Crec=28.4749
2 / 2 propositions
CASE ATLAS · 05
180 rollouts support longitudinal comparison across λ and cross-sectional comparison across episodes.
Fully successful endpoint outcomes still contain distinct recovery costs and paired sensitivities.
Outcome variation and support loss expose path-level missingness before family-level aggregation.
Mixed tasks expose repeated recovery windows, high-stress divergence, and incomplete boundary support.
6 λ cells · recovery-window expansion
Open case STABILITY CASEEpisode 144 · seed 2Clean–stress rollback · β=3.300
Open case GE CASEEpisode 78 · seed 1Placement-family stress boundary
Open case| Family | Episode | Success | Completion | Crec valid | Rebound paths | β peak | Stability paths | GE support official / strict |
|---|---|---|---|---|---|---|---|---|
| Placement | 75 | 100% | 100% | 15/18 | 2/3 | 0.790 | 2/3 | 2/3 · 2/3 |
| Placement | 78 | 100% | 100% | 18/18 | 3/3 | 1.746 | 3/3 | 3/3 · 2/3 |
| Placement | 98 | 100% | 100% | 18/18 | 3/3 | 1.905 | 3/3 | 3/3 · 3/3 |
| Spatial | 131 | 100% | 100% | 0/18 | 0/3 | — | 0/3 | 0/3 · 0/3 |
| Spatial | 144 | 66.7% | 92.2% | 15/18 | 1/3 | 3.300 | 1/3 | 1/3 · 1/3 |
| Spatial | 174 | 55.6% | 77.8% | 9/18 | 0/3 | — | 0/3 | 0/3 · 0/3 |
| Mixed | 239 | 100% | 100% | 17/18 | 2/3 | 1.151 | 2/3 | 2/3 · 2/3 |
| Mixed | 258 | 94.4% | 95.6% | 16/18 | 1/3 | 1.146 | 1/3 | 1/3 · 1/3 |
| Mixed | 290 | 94.4% | 97.8% | 17/18 | 2/3 | 1.430 | 2/3 | 2/3 · 2/3 |
| Mixed | 304 | 0% | 66.7% | 0/18 | 0/3 | — | 0/3 | 0/3 · 0/3 |