
Placement 3, Spatial 3, Mixed 4; each episode is executed with three seeds.
ANALYSIS DENOMINATORS
Analysis denominators
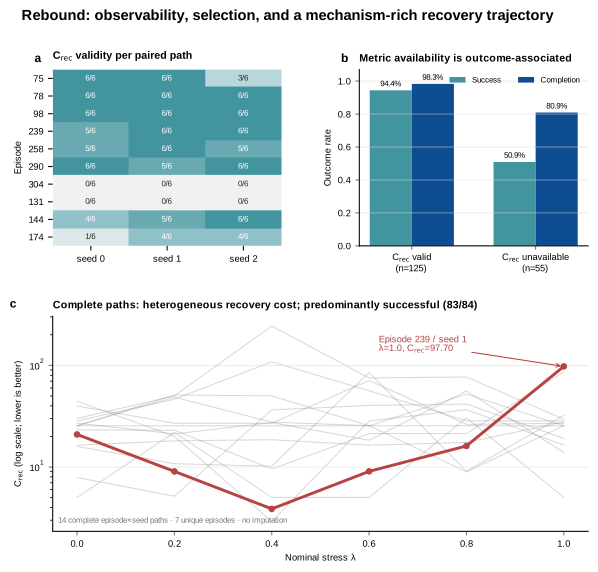
Rebound inference is reported at three denominators. The 180 executions define total coverage, 125 valid Crec values define rollout-level observability, and 14 complete episode×seed paths define the six-stress paired set.
Each path contains six scheduled levels λ∈{0,.2,.4,.6,.8,1}, yielding six independent rollouts.
Formal Crec is available for 69.4% of execution rows; the remaining 55 rows retain N/A.
Fourteen paths are valid across all six levels and cover 7/10 episodes; these paths form the paired-curve set.
Metric completeness requires additional observation support. All 180 rollouts across 10 episodes executed. Rebound observability further requires closed window boundaries, a valid disturbance anchor, StageBaseline-aligned recovery covariance, and an episode-stage remaining-work denominator.
FORMAL DEFINITION · rebound_c_rec_v3
Recovery-cost definition
Recovery Cost is computed as a discrete weighted sum over each closed window. Cognitive, physical, and state-debt deviations from StageBaseline are converted to covariance-normalized distances, weighted by simulated work, and normalized by the remaining clean work at the window-entry episode stage.
\[
g_u(t)=\sqrt{\max\!\left\{0,\;x_u(t)^{\mathsf T}
\left[\Sigma_u+\varepsilon I\right]^{-1}x_u(t)\right\}},
\qquad u\in\{\mathrm{cog},\mathrm{phy},\mathrm{debt}\}.
\]
\[
I_{\mathrm{rec}}(t)=
\sqrt{\frac{g_{\mathrm{cog}}(t)^2+g_{\mathrm{phy}}(t)^2+g_{\mathrm{debt}}(t)^2}{3}}.
\]
\[
G_{\mathrm{rec},j}=\sum_{t=t_{d,j}}^{t_{r,j}}
\frac{\max\!\left(\Delta\tau_{\mathrm{sim},t},1\right)}
{\max\!\left(\tau^{*}(a_t),\varepsilon\right)}
I_{\mathrm{rec}}(t).
\]
\[
C_{\mathrm{rec},j}=
\frac{G_{\mathrm{rec},j}}
{W^{*}_{\mathrm{rem}}(e,s_{d,j})+\varepsilon},
\qquad
C_{\mathrm{rec}}=\sum_{j\in\mathcal J_{\mathrm{closed}}}C_{\mathrm{rec},j}.
\]
Here, \(\Delta\tau_{\mathrm{sim},t}\) is observed simulated work, \(\tau^{*}(a_t)\) is the stage- and action-matched clean time scale, and \(W^{*}_{\mathrm{rem}}(e,s_{d,j})\) is clean remaining work at window entry. The term \(\varepsilon=10^{-6}\) regularizes covariance and denominator calculations; lower \(C_{\mathrm{rec}}\) indicates lower recovery burden. The statistical unit is one rollout, and paired stress analysis uses one episode–seed path.
N/A and zero
- No raw recovery window: Crec=0 and valid=1, recording no observed recovery burden.
- All observed windows are closed and formally supported: report the sum of Crec,j across windows.
- At least one window is censored or lacks formal support: the row-level Crec=N/A; the sum over supported windows is retained only as an observed lower bound.
- Observed lower bound: It is stored as a censoring diagnostic, receives no imputation or zero substitution, and remains outside the 14 complete curves.
Formal-support gaps that trigger N/A include an episode-tail censor, an invalid td anchor, missing episode-stage W*rem, missing StageBaseline support, or missing recovery covariance.
ALL TEN EPISODES
Coverage and response curves
Figure R1 summarizes Rebound support and response shape across the full batch. Panel a reports valid stress cells, panel b relates metric availability to task outcome, and panel c shows the 14 complete curves with Episode 239 / seed 1 highlighted for mechanism analysis.
EPISODE ATLAS
Ten-episode observability
Each episode contains 18 rollouts. Medians and maxima use valid rows only; complete seeds identify seeds with valid Crec across all six levels. Episodes with N/A remain outside cost rankings.
| Family | Episode | Crec valid | Median | Maximum | Success | Completion | Complete seeds |
|---|---|---|---|---|---|---|---|
| Placement | 75 | 15/18 | 32.55 | 120.74 | 100% | 100% | 0, 1 · 2/3 |
| Placement | 78 | 18/18 | 25.47 | 52.17 | 100% | 100% | 0, 1, 2 · 3/3 |
| Placement | 98 | 18/18 | 20.17 | 56.01 | 100% | 100% | 0, 1, 2 · 3/3 |
| Spatial | 131 | 0/18 | — | — | 100% | 100% | — · 0/3 |
| Spatial | 144 | 15/18 | 22.82 | 86.34 | 66.7% | 92.2% | 2 · 1/3 |
| Spatial | 174 | 9/18 | 38.99 | 79.19 | 55.6% | 77.8% | — · 0/3 |
| Mixed | 239 | 17/18 | 16.40 | 97.70 | 100% | 100% | 1, 2 · 2/3 |
| Mixed | 258 | 16/18 | 31.45 | 243.72 | 94.4% | 95.6% | 1 · 1/3 |
| Mixed | 290 | 17/18 | 28.39 | 85.11 | 94.4% | 97.8% | 0, 2 · 2/3 |
| Mixed | 304 | 0/18 | — | — | 0% | 66.7% | — · 0/3 |
| Total | 125/180 | 7/10 episodes contribute at least one complete path | 14/30 paths | ||||
COMPLETE-PAIR SOURCE
Complete paired paths
The table indexes the complete-path set. Each row represents six independent rollouts; λ=0 and λ=1 provide endpoint descriptions. Episode 144 / seed 2 has complete Crec coverage and succeeds in 5/6 runs.
| Family | Episode | Seed | Crec(0) | Crec(1) | Valid cells | Success | Mean completion |
|---|---|---|---|---|---|---|---|
| Placement | 75 | 0 | 28.475 | 28.464 | 6/6 | 6/6 | 1.000 |
| Placement | 75 | 1 | 39.829 | 26.942 | 6/6 | 6/6 | 1.000 |
| Placement | 78 | 0 | 25.473 | 25.463 | 6/6 | 6/6 | 1.000 |
| Placement | 78 | 1 | 25.517 | 25.527 | 6/6 | 6/6 | 1.000 |
| Placement | 78 | 2 | 25.463 | 25.463 | 6/6 | 6/6 | 1.000 |
| Placement | 98 | 0 | 5.021 | 5.021 | 6/6 | 6/6 | 1.000 |
| Placement | 98 | 1 | 26.979 | 13.906 | 6/6 | 6/6 | 1.000 |
| Placement | 98 | 2 | 7.889 | 19.143 | 6/6 | 6/6 | 1.000 |
| Spatial | 144 | 2 | 23.215 | 86.336 | 6/6 | 5/6 | 0.967 |
| Mixed | 239 | 1 | 20.925 | 97.703 | 6/6 | 6/6 | 1.000 |
| Mixed | 239 | 2 | 16.400 | 27.705 | 6/6 | 6/6 | 1.000 |
| Mixed | 258 | 1 | 30.094 | 29.506 | 6/6 | 6/6 | 1.000 |
| Mixed | 290 | 0 | 15.958 | 32.264 | 6/6 | 6/6 | 1.000 |
| Mixed | 290 | 2 | 44.478 | 16.399 | 6/6 | 6/6 | 1.000 |
CASE SELECTION
Case-selection criteria
Case selection first requires valid Crec at all six stress levels. Among eligible paths, priority is assigned to six successful runs, multiple formal windows at λ=1, and trace evidence that resolves the recovery mechanism; endpoint difference remains a descriptive field.
Episode 239 / seed 1
All six levels are valid with 6/6 success; Crec increases from 20.925 at clean to 97.703 at λ=1, an endpoint difference of +76.777; formal windows increase from one to five. The trace locates repeated reachability failures, Rebound Guidance, and action-abstraction repair.
Comparative mechanism evidence
Episode 258 / seed 1 reaches the batch maximum of 243.72 at λ=.4, with clean=30.09 and λ=1=29.51, establishing a strongly non-monotonic path. Episode 239 / seed 1 additionally exposes a five-window accumulation process at the high-stress endpoint.
Interpretation scope
The case resolves the formation of a successful execution with high recovery cost. Episode 239's population position and the stress response of Crec remain anchored to cluster statistics over the 14 complete paths.
 IMAGEGEN · TRACE-DRIVEN MECHANISM ILLUSTRATION
PRIMARY CASE STUDY · EPISODE 239 / SEED 1 / λ=1
High-cost successful recovery
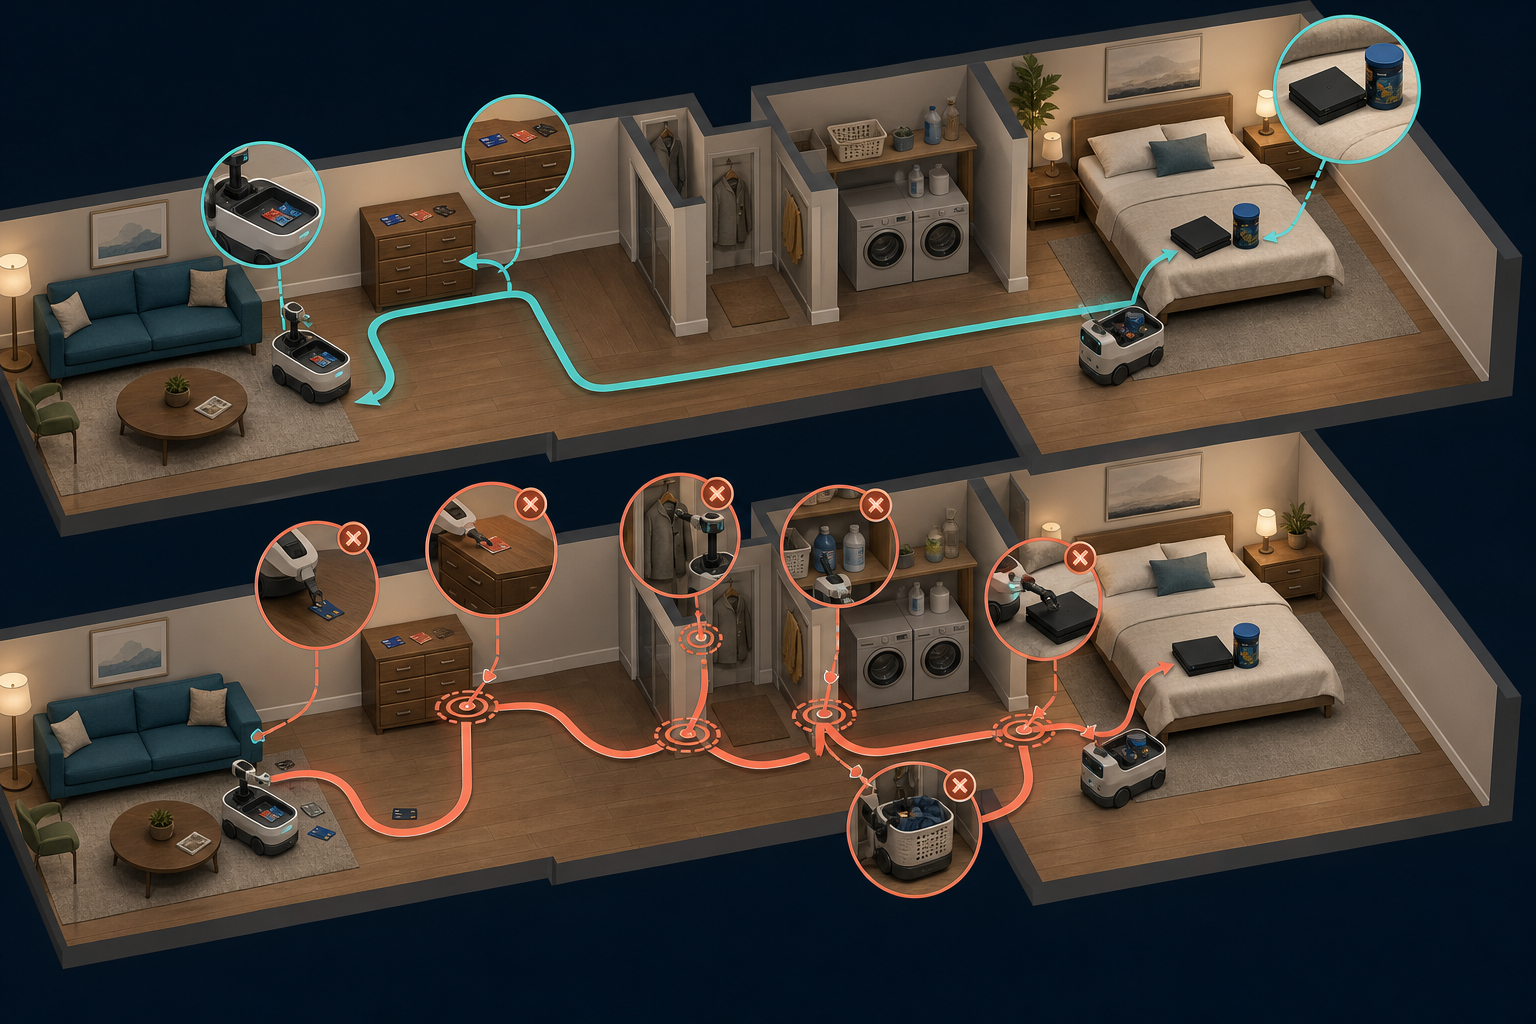
The task contains two ordered phases: place three credit cards on the living-room chest of drawers, then place the gaming console and canister on the bedroom bed next to each other. At λ=1, three irrelevant laundry-room scene facts are appended to the policy instruction.
The trace records repeated Pick and Navigate attempts before stagnation feedback prompts a five-argument Rearrange call. The repaired execution reaches proposition_satisfied_fraction=1.0 while accumulating five formal recovery windows and Crec=97.703.
Evidence boundary
The ImageGen figure encodes the task–failure–repair–completion mechanism. Room geometry, robot pose, grasp motion, path, and spatial scale are illustrative. Quantitative claims derive from the raw rollout, Rebound JSON, and planner trace.
The ImageGen figure encodes the task–failure–repair–completion mechanism. Room geometry, robot pose, grasp motion, path, and spatial scale are illustrative. Quantitative claims derive from the raw rollout, Rebound JSON, and planner trace.
CLEAN Crec20.925
λ=1 Crec97.703
FORMAL WINDOWS1 → 5
PROPOSITION FRACTION1.0
ENGLISH ASPECT VIDEO · EVIDENCE-ALIGNED
Episode 239 at \(\lambda=1\)
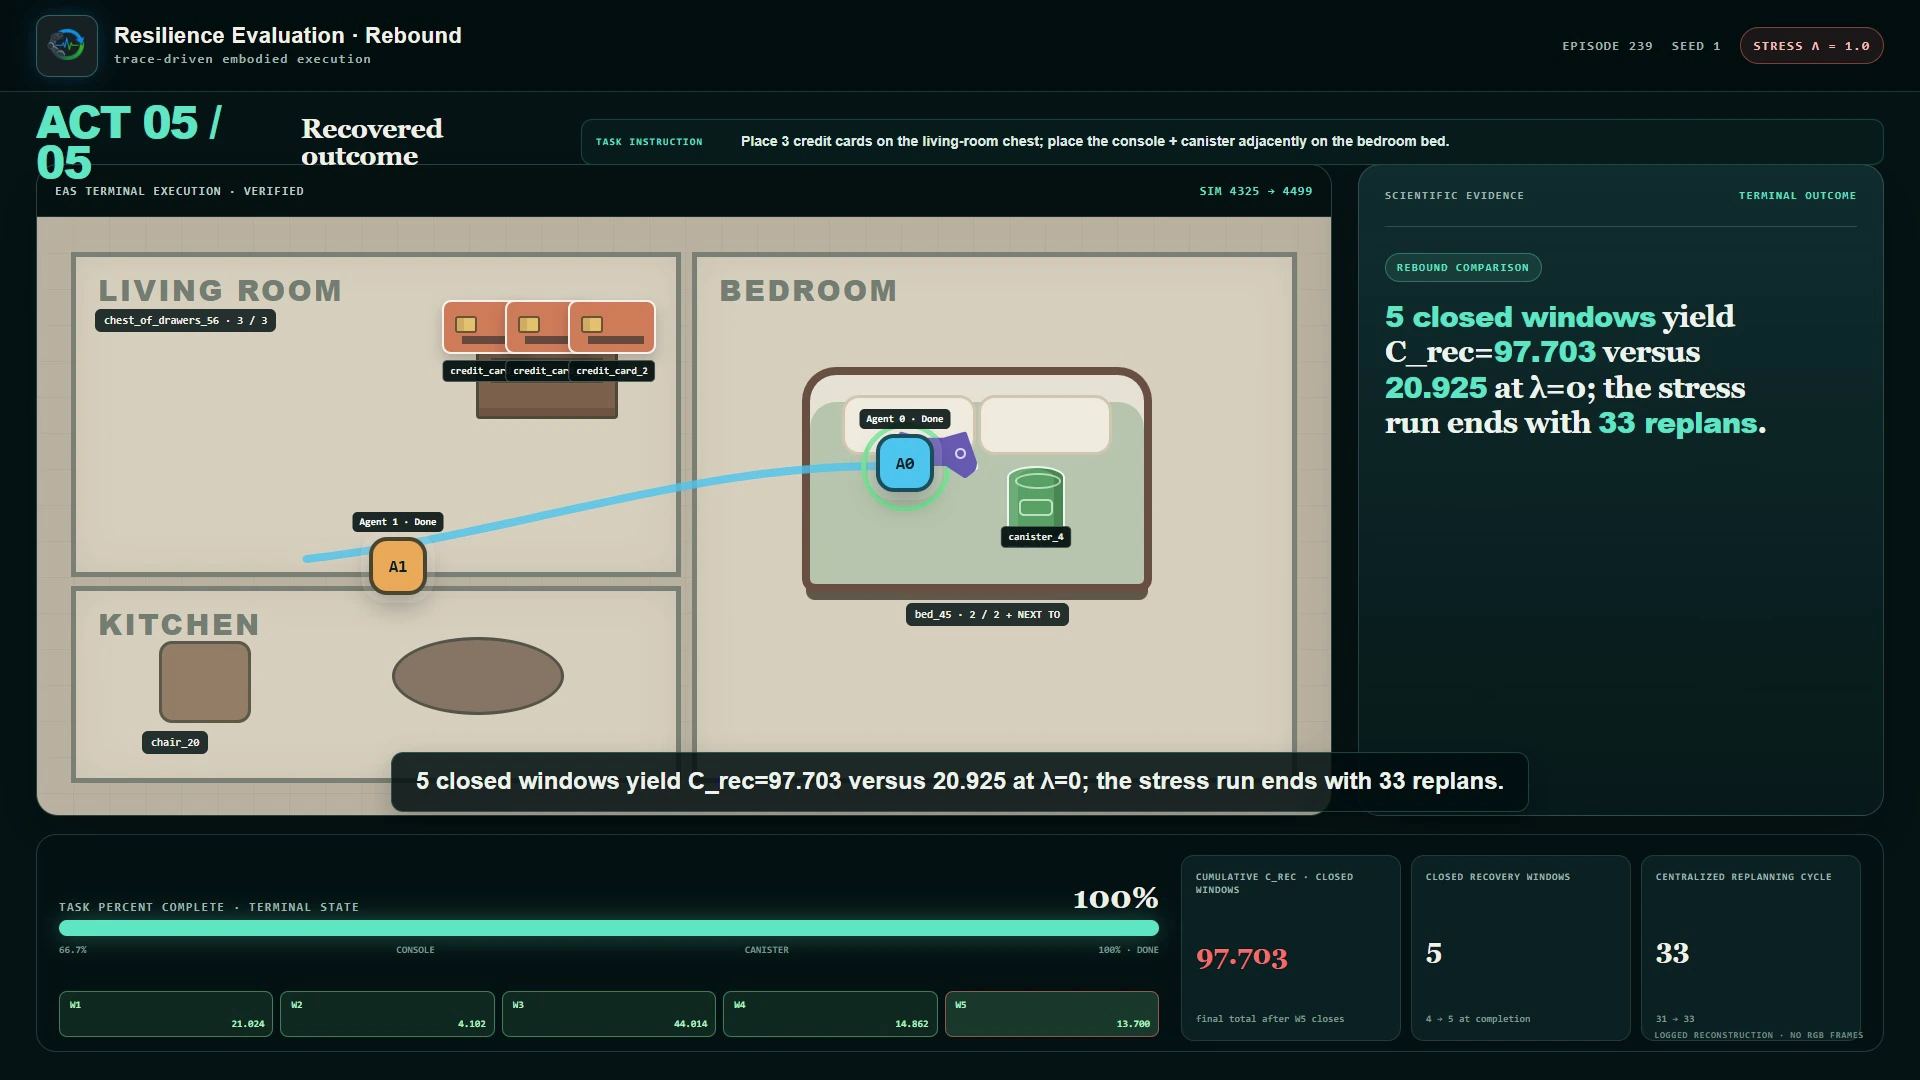
This trace-driven reconstruction compares the matched clean and λ=1 executions for Episode 239 / seed 1. Five planning-state nodes expose the expansion from one to five recovery windows; Crec is a rollout-level normalized recovery cost, with lower values indicating lower burden.
TRACE-ALIGNED INTERACTIVE CASE ATLAS
Longitudinal and cross-sectional evidence
The interactive atlas applies two prespecified comparison rules to all 180 runs. The longitudinal view fixes Episode 239 / seed 1 across six λ levels; the cross-sectional view fixes seed 1 / λ=1 across episodes. Each panel links the task contract and planning transition to a trace-grounded Thought summary, Action, Observation, and simulation metric.
REBOUND · REPRESENTATIVE EXECUTION
Recovery profiles and mechanisms
The longitudinal comparison resolves window structure across six independent runs of one task. The cross-section presents low-cost completion, multi-window completion, and metric-unavailable controls under one field contract.
LONGITUDINAL COMPARISON
Episode 239 stress trajectories
The task first places three credit cards in the living room, then co-locates the gaming console and canister in the bedroom. Episode identity, seed, planner, Judge, and evaluation configuration remain fixed; each λ denotes an independent rollout.
Selection: 6/6 valid Crec values, 6/6 successful runs, and 10 formal windows; Crec spans 3.875–97.703. A0/A1 replan fields mirror the centralized cycle, so this section reports replanning_count_0.
- Task family
- mixed_temporal
- Episode × seed
- 239 × 1
- Task contract
- credit cards → chest of drawers; console + canister → bed / next_to
- Metric direction
- Crec ↓; N/A remains unavailable
Clean: abstraction repair
- Locate task regions and objects
After Navigate/Explore in the living room, the planner locates three credit cards in the kitchen and the target bed in the bedroom.
- Pick-distance failures and action-contract error
Pick repeatedly returns not close enough for credit_card_2; the tool contract then rejects a two-argument Rearrange call.
- Switch to five-argument Rearrange
The planner supplies the spatial relation and optional fields, places all three credit cards, and moves completion from 0 to 0.5.
- Idle-control feedback requests productive action
Dual Wait is rejected and the trace requests an immediate Navigate, Pick, Place, Open, or Close action.
- Place closes the spatial relation and terminates
gaming_console_3 is placed on bed_45 with canister_4 as reference, raising proposition fraction to 1.0.
\(\lambda=.2\): relation repair
- The first Rearrange call omits required fields
Both agents receive two-argument calls; the tool response returns the correct five-argument contract.
- Parallel credit-card transport after Explore
The planner uses instance-specific object identifiers and the on relation; all three cards progressively reach chest_of_drawers_56.
- next_to reference-object and placement-feasibility conflict
Agent 0 lacks a reference object; Agent 1 subsequently receives no valid placements.
- Establish the reference object, then use Place
The gaming console reaches the bed first; the agent already holding the canister uses Place to satisfy the next_to relation.
- All six propositions are satisfied
Place returns Successful execution and both agents enter Done.
\(\lambda=.4\): minimum recovery cost
- Generic object names and shorthand calls are rejected
Generic credit_card and gaming_console names, together with two-argument calls, trigger an API error.
- Bind instance identifiers after dual-region exploration
The two agents Explore the living room and bedroom, then use the exact credit_card_0/1 identifiers.
- Complete all three credit cards in sequence
Completion reaches 0.5 and the planner switches to the gaming-console and canister subtask.
- Parallel bedroom placement by both agents
Two Rearrange calls progress concurrently; the canister action returns success at sim 1492.
- Terminate at the complete task state
task_state_success=true, completion=1.0.
\(\lambda=.6\): object rebinding
- Both agents request PerceptionScan
The world-graph refresh is deferred, and the planner waits for the next observation update.
- Empty action and shorthand Rearrange fail in sequence
Wait receives no actions assigned; the next call lacks the complete contract fields.
- Explore restores exact object context
Exploration returns the locations of credit_card_0/1/2, allowing the planner to rebuild the object-to-target map.
- Progress through both placement phases
Credit-card completion reaches 0.5; gaming console and canister actions proceed in parallel to 0.833.
- Canister execution closes the task
Agent 1 returns Successful execution and completion reaches 1.0.
\(\lambda=.8\): sequential completion
- Empty action and collection-level object name are rejected
Dual Wait triggers no action; the collection name “credit cards” and a two-argument call then trigger a tool error.
- Bind credit_card_1 after Explore
The planner recovers instance names from the world update and starts the first credit-card transport.
- Complete the credit-card phase
credit_card_0 and credit_card_2 reach the target in sequence, raising completion to 0.5.
- Execute the bedroom phase in dependency order
gaming_console_3 reaches the bed first; canister_4 then satisfies the next_to constraint.
- All propositions satisfied; enter Done
task_state_success=true, completion=1.0.
\(\lambda=1\): five recovery windows
- Empty action, exploration, and the first Pick-distance failure
The planner starts from an empty object table, uses Navigate/Explore, and then attempts a kitchen credit-card Pick that returns not close enough.
- Repair through an explicit Navigate–Pick–Place chain
The system navigates through the chair, living room, and chest of drawers; repaired Place fields and proximity conditions complete the first card.
- Reuse the repair strategy for the second card
Navigate→Pick→Navigate→Place succeeds and completion reaches 0.333.
- The third card enters repeated reachability stagnation
Pick fails repeatedly near the floor, Explore region, and table; Rebound Guidance marks progress_stagnation three times.
- Raise action abstraction from shorthand to five-argument Rearrange
After the two-argument call is rejected, the complete call moves credit_card_2 successfully and brings the credit-card phase to 3/6.
- Close the gaming-console phase
After Navigate to the kitchen, Rearrange places gaming_console_3 on bed_45 and completion reaches 0.667.
- Complete the canister and terminate
The final Rearrange returns Successful execution; proposition fraction and completion both reach 1.0.
CROSS-SECTIONAL COMPARISON
High-stress episode comparison
The five trajectories come from the complete ten-episode atlas. Episodes 75 and 98 provide one-window placement controls; Episode 174 provides a spatial-relation, two-window control; Episode 239 provides a five-window mixed-temporal high-burden trajectory; Episode 304 retains task failure and Crec=N/A as a missingness control.
Cross-family values jointly reflect task structure and execution mechanism, so family labels remain visible. The view supports mechanism review; same-family estimates can be restricted to Episodes 239/258/290 in the atlas.
- Fixed setting
- seed 1 · λ=1.0
- Planner / Judge
- joint Qwen3.5 · GPT-5.1 critic
- Episode coverage
- 5 selected from 10
- Contrast fields
- family · outcome · windows · Crec · events
Two-toy couch placement
- PerceptionScan followed by living-room Explore
The planner moves from delayed refresh to active exploration and binds stuffed_toy_0, toy_vehicle_1, and couch_23.
- Two-argument Rearrange is rejected
Both agent calls omit the on relation and trailing fields.
- Repair both calls for parallel execution
The stuffed toy and toy vehicle reach couch_23 in parallel.
- Done
success=true, completion=1.0.
Three-object couch placement
- Rebuild the search path after empty actions
Dual Wait is rejected; the living-room navigation returns no target objects, and the planner redirects to office_1.
- Explore the office and locate three objects
The world update returns instance identifiers for the laptop, monitor stand, and credit card.
- Repair the Rearrange contract and complete the laptop
After the shorthand call fails, the five-argument call succeeds and completion reaches 0.333.
- Complete the monitor stand and credit card in sequence
Two long Rearrange actions raise completion to 1.0.
- Done
All three objects are located on couch_11.
Relation-contract conflict
- Room-level Rearrange target fails
The shorthand phone-to-bedroom_1 call is rejected and the planner enters living-room Explore.
- Locate cellphone_0 and revise agent allocation
One agent enters the bedroom while the other returns to the living room; the first Pick fails on distance.
- Repeated Pick and next_to contract conflict
Pick still fails after Explore; room is an invalid receptacle, Place accepts on/within, and held-object state blocks Rearrange.
- Fallback to Place on bed_45
The final action returns Successful execution and the runtime metric records completion=1.0.
- Terminal log preserves the semantic qualification
The terminal Thought explicitly distinguishes “on the bed” from “beside the bed” while task_state_success=true.
Five-window completion
- Complete two credit cards through an explicit low-level chain
After repeated distance and Place failures, Navigate–Pick–Place becomes a reusable sequence.
- The third card enters prolonged stagnation
Rebound Guidance labels repeated Pick failures as progress_stagnation.
- Five-argument Rearrange closes the largest window
W2 contributes 44.0136, representing 45.05% of total Crec.
- Complete the bedroom phase
Console and canister correspond to W3/W4 and terminate with success=true.
Incomplete N/A control
- Empty object table and two contract errors
The shorthand plant call fails; Explore binds plant_container_0, and the first concrete call still omits trailing fields.
- Complete the temporal plant transport
The plant first reaches table_30 and then bench_10, raising completion to 0.5.
- Office Explore and cushion placement
cushion_1 moves to table_36; the planner then explores the bedroom.
- Premature Done after the toy-vehicle step
After Rearrange executes, the terminal state records completion=0.75 and task_state_success=false.
Atlas provenance: Selection covers all 180 rollouts. run_index retains each task, metric, artifact path, and statistical field; planning_event_index retains 3,115 trace-aligned planning transitions; case_selection records longitudinal and cross-sectional rules.
FORMAL WINDOW DECOMPOSITION
Five-window decomposition
The λ=1 total Crec=97.7026 is the discrete sum of five complete formal recovery windows. The window table reports each contribution and its episode-stage baseline match, including the mixed match status produced by multiple auditable stage-level references.
| Window | td–tr | Crec,j | Contribution | Mechanistic reading |
|---|---|---|---|---|
| W0 | 2–1944 | 21.0245 | 21.52% | Long startup window containing the first Pick failure and Place-call format error. |
| W1 | 1945–2109 | 4.1023 | 4.20% | Short closed window with the smallest cost contribution. |
| W2 | 2197–3666 | 44.0136 | 45.05% | Repeated distance failures for credit_card_2, exploration, and action-abstraction repair form the largest cost interval. |
| W3 | 3667–4133 | 14.8619 | 15.21% | Gaming-console phase; the task moves from credit-card placement to bedroom placement. |
| W4 | 4134–4500 | 13.7004 | 14.02% | Canister phase completes the adjacency relation and enters Done. |
| Total | 97.7026 | 100% | Discrete sum over five closed windows. | |
SIX INDEPENDENT ROLLOUTS
Independent stress rollouts
The six points share episode=239 and perturbation seed=1 and launch as independent rollouts. Selecting λ highlights that execution. A0/A1 replans mirror the same centralized planning cycle; the page uses replanning_count_0.
| λ | Text dose | Crec ↓ | Formal windows | Sim steps | Replans A0/A1 | Outcome |
|---|---|---|---|---|---|---|
| 0.0 | 0.000 | 20.925 | 1 | 2689 | 16 / 16 | success |
| 0.2 | 0.230 | 9.058 | 1 | 2314 | 11 / 11 | success |
| 0.4 | 0.459 | 3.875 | 1 | 1493 | 8 / 8 | success |
| 0.6 | 0.639 | 9.067 | 1 | 2098 | 10 / 10 | success |
| 0.8 | 0.820 | 16.135 | 1 | 2467 | 9 / 9 | success |
| 1.0 | 1.000 | 97.703 | 5 | 4499 | 33 / 33 | success |
The path values are 20.93, 9.06, 3.88, 9.07, 16.13, and 97.70, forming a non-monotonic response. At λ=1, C rec increases by 76.78 from clean and reaches 4.67× clean. The curve provides within-path mechanism evidence; the complete paired set supports population-level stress analysis.
TRACE-ALIGNED MECHANISM
Metric–behavior alignment
The left lane uses Rebound JSON td/tr and Crec,j; the right lane uses the planner trace and action sequence. Both lanes explain recovery cost, while formal window boundaries follow Rebound tracker td/tr. API errors, Rebound Guidance, and individual failures are reported as within-window behavioral evidence.
FORMAL METRIC LANE
Rebound windows
-
W0 · 2–194421.0245
Long startup recovery window covering early Pick/Place failures.
-
W1 · 1945–21094.1023
Short closed window followed by an 87-step interval outside a window.
-
W2 · 2197–366644.0136
Largest contribution window; the credit-card phase completes at its endpoint.
-
W3 · 3667–413314.8619
Gaming-console phase.
-
W4 · 4134–450013.7004
Canister phase and task completion.
BEHAVIOR EVIDENCE LANE
Planner / action events
-
sim 1670 · W0
First Pick failure; the agent has not reached the target.
-
sim 1757 · W0
Place parameter-format error; the trace returns wrong use of API.
-
sim 2342–3441 · W2
credit_card_2 repeatedly fails Pick on distance, accompanied by Rebound Guidance, Explore, and Navigate.
-
sim 3442 → 3443 · W2
The two-argument Rearrange is rejected; the five-argument repair succeeds and raises action abstraction.
-
sim 3665 · W2
Credit-card propositions reach 3/6; W2 closes at 3666.
-
sim 3824 / 4132 · W3
Gaming-console Rearrange completes and the task reaches 4/6.
-
sim 4323 → 4499 · W4
Canister Rearrange ends at proposition_satisfied_fraction=1.0 and Done.
Alignment rule: “within a window” denotes temporal co-occurrence; only Rebound tracker td/tr defines a formal window. Behavioral events explain cost formation and leave tracker boundaries unchanged.
STATISTICAL LIMITS & MISSINGNESS
Population inference limits
Population-level inference is restricted to 14 complete episode×seed paths covering seven episodes and 84 rollouts. Episode-cluster procedures operate on this available-case set, while all 55 N/A rows remain visible in the support audit.
A repeated-measures label permutation over 14 complete paths gives p=0.737963, providing no detected omnibus stress effect.
The episode-weighted λ1−λ0 difference is +13.3759; the 95% episode-cluster bootstrap CI is [−3.5308, 34.0994], with exact sign-flip p=0.50.
The 125 valid rows have success=94.4% and completion=98.32%; the 55 invalid rows have success=50.9% and completion=80.91%. This descriptive association indicates outcome-related missingness.
Exact reason counts: invalid td anchor 19; partial tail-censored 16; partial missing W*rem 13; direct missing W*rem 4; mixed partial reasons 3.
Observed lower bounds
Nineteen N/A rows retain observed lower bounds, recording recovery burden already accumulated. Incomplete windows keep these values separate from formal Crec and from missing-value substitution.
Episode-level blind spots
Episodes 131 and 304 have 0/18 formal Crec values; Episode 174 has 9/18 valid rows and no complete six-level seed. They remain in the execution atlas and outside complete-curve inference.
Supported interpretation: Episode 239 / seed 1 shows how multi-window stagnation, action-contract repair, and later strategy reuse form a successful execution with high recovery cost. Inference boundary: A monotonic stress response for Crec and an unbiased population effect over all ten episodes remain unresolved by the 125 valid rows.